
BP · Pulse · SpO₂
Plus respiratory rate
Sedation score
Alert → Unresponsive
Every 15 minutes
Auto-calculated
Nothing missed
Mandatory fields flagged
Row-level notes
Airway, agents, events
Any device
Built for the iPad
Every chart
Draft or finalised
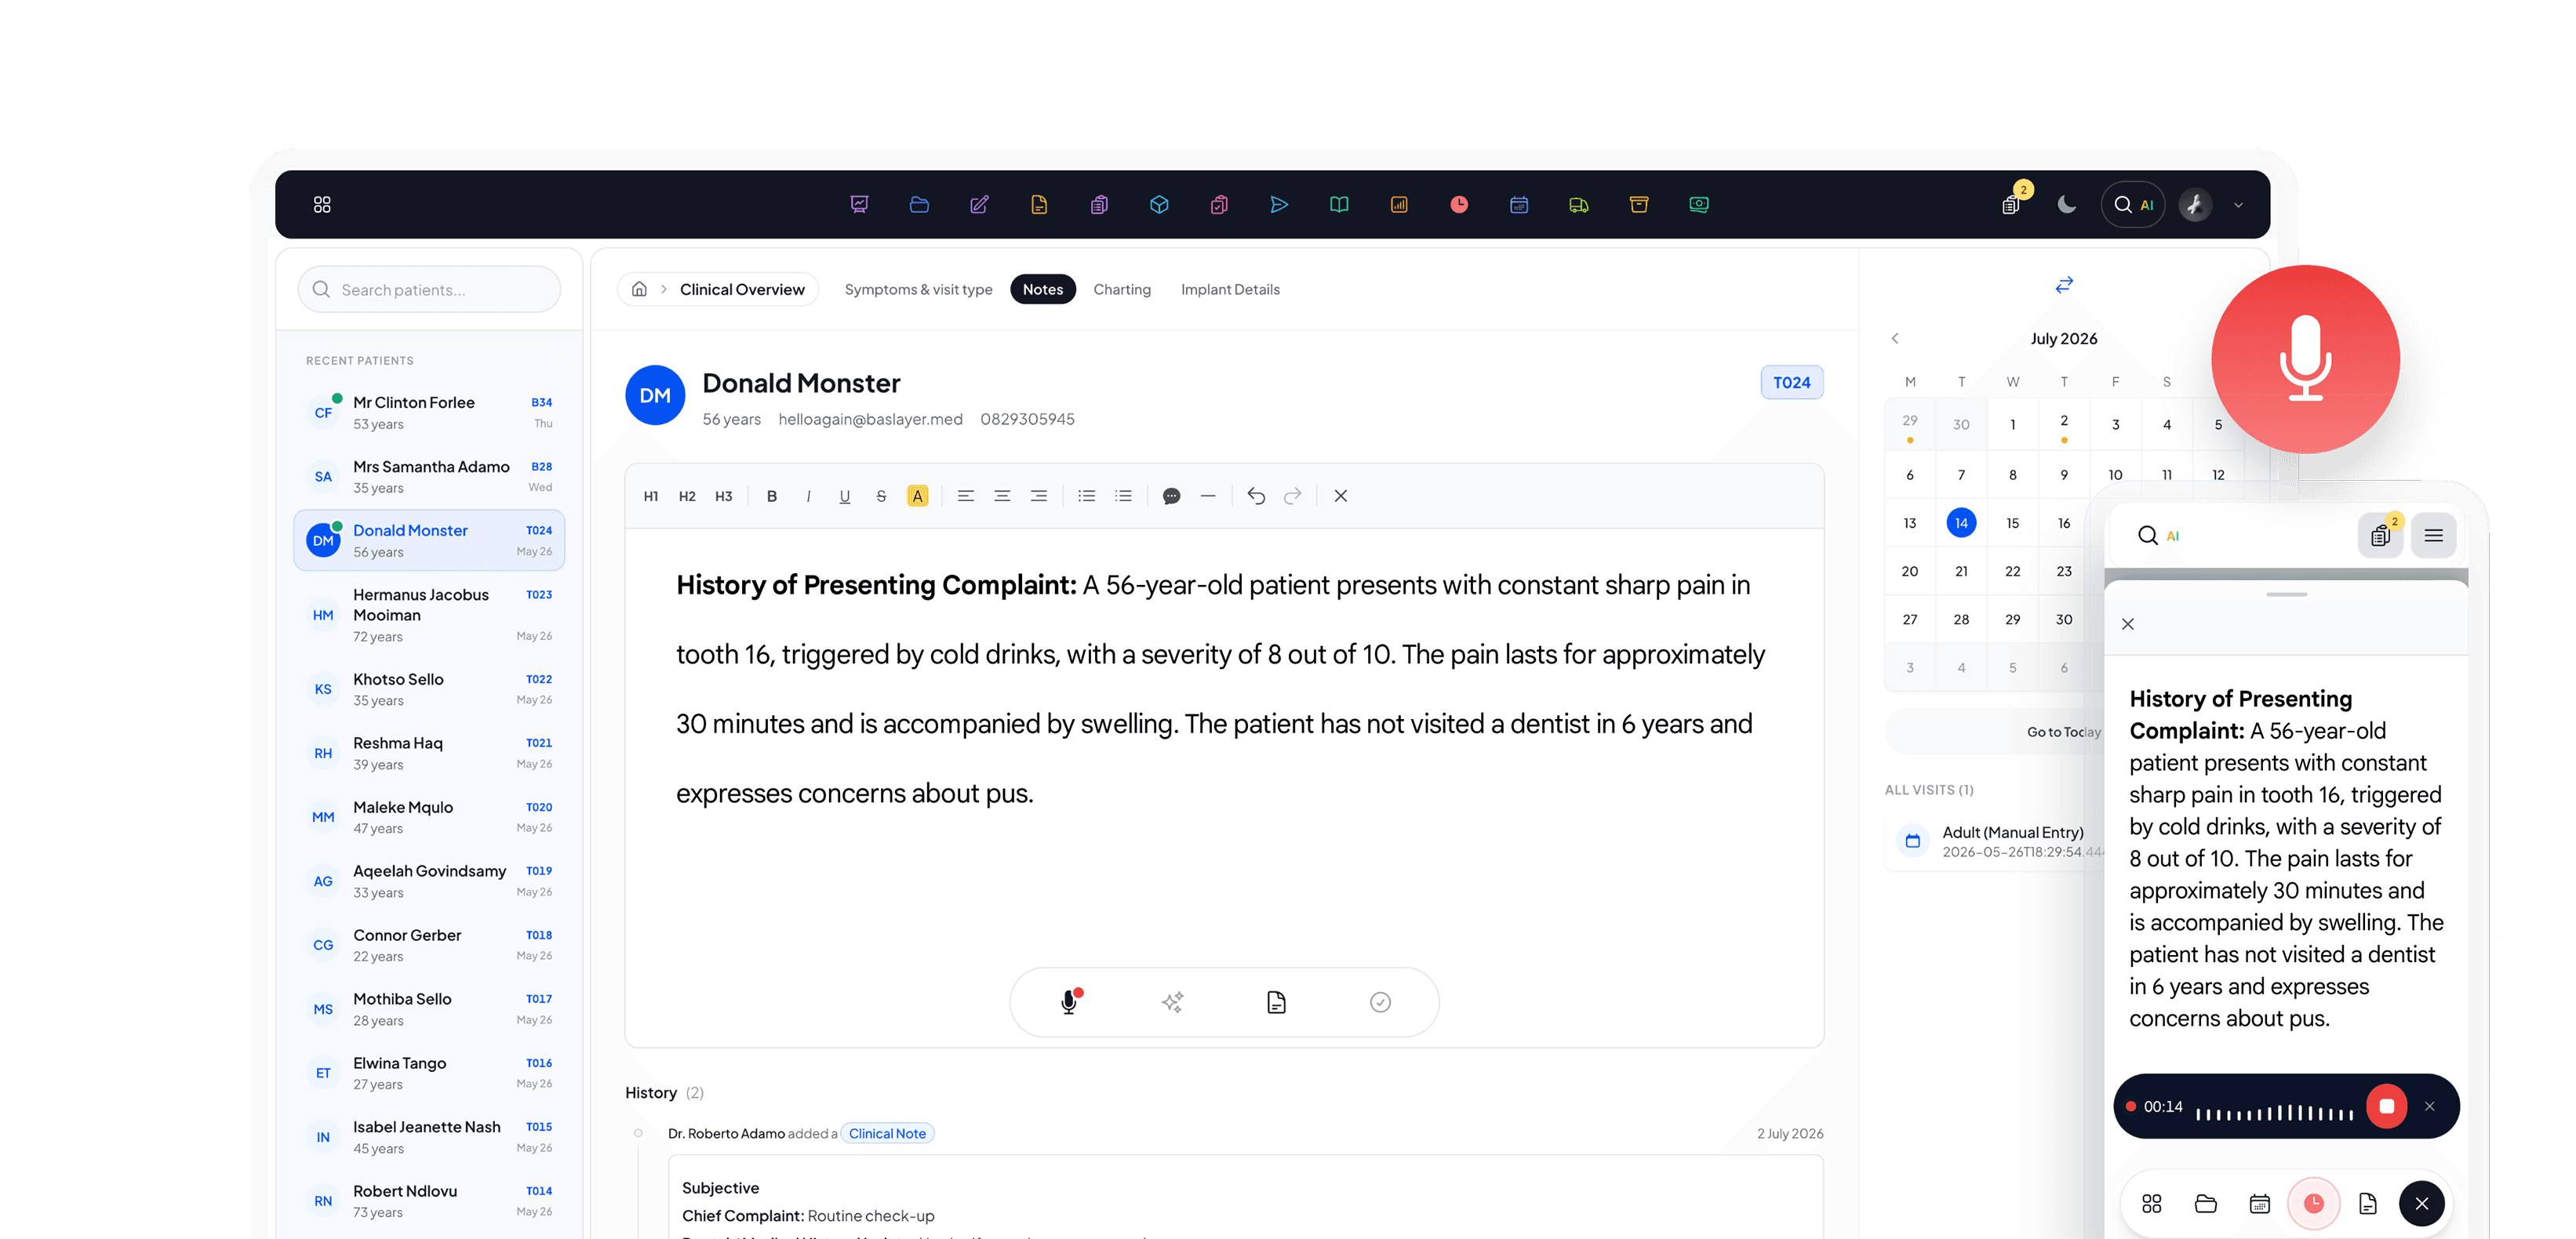
Every vital, every interval, captured.
A structured sedation-monitoring chart built for anaesthetists. Capture BP, pulse, SpO₂, respiratory rate, and sedation score one observation at a time, with auto-calculated 15-minute intervals, mandatory-field highlighting, and instant saves.

One row,
per observation.
Each observation is a structured row, blood pressure, pulse, SpO₂, respiratory rate, sedation score, and notes, stored vertically in the record so trends read top-to-bottom at a glance. No free-text vitals buried in a paragraph.
Next interval, pre-filled.
Tap Add Observation and the chart calculates the next 15-minute interval, creates the row, and highlights any missing mandatory fields. Every entry saves instantly, no Save button to forget mid-case.

Auto 15-min interval
The next observation time is pre-filled at 15-minute intervals.

Mandatory highlighting
Required vitals are highlighted so nothing gets skipped.

Saves instantly
Each entry saves the moment it is captured.
Every case,
on file.
Charts are versioned per case and filed to the patient record alongside the anaesthetic consent, so a sedation list reads as a narrative, not a stack of loose monitoring sheets. Draft charts stay editable; finalised charts are locked to the signing anaesthetist.

Per-case history
Every case is kept on file with its complete observation history.

Draft → Finalised
Work in draft, then finalise to lock the record.
Filed to the record
Finalised charts file straight to the patient record.
Explore more solutions
Every feature works together as part of one connected platform.