Surface marks
M · O · D · B · L
6-point probing
PD + recession + BoP
Plan ahead
Proposed vs existing
Auto-computed
Colour-coded severity
Every chart
Draft or finalized
Any device
Tap to mark
Standardised
Adult + primary
Every tooth, every visit, charted.
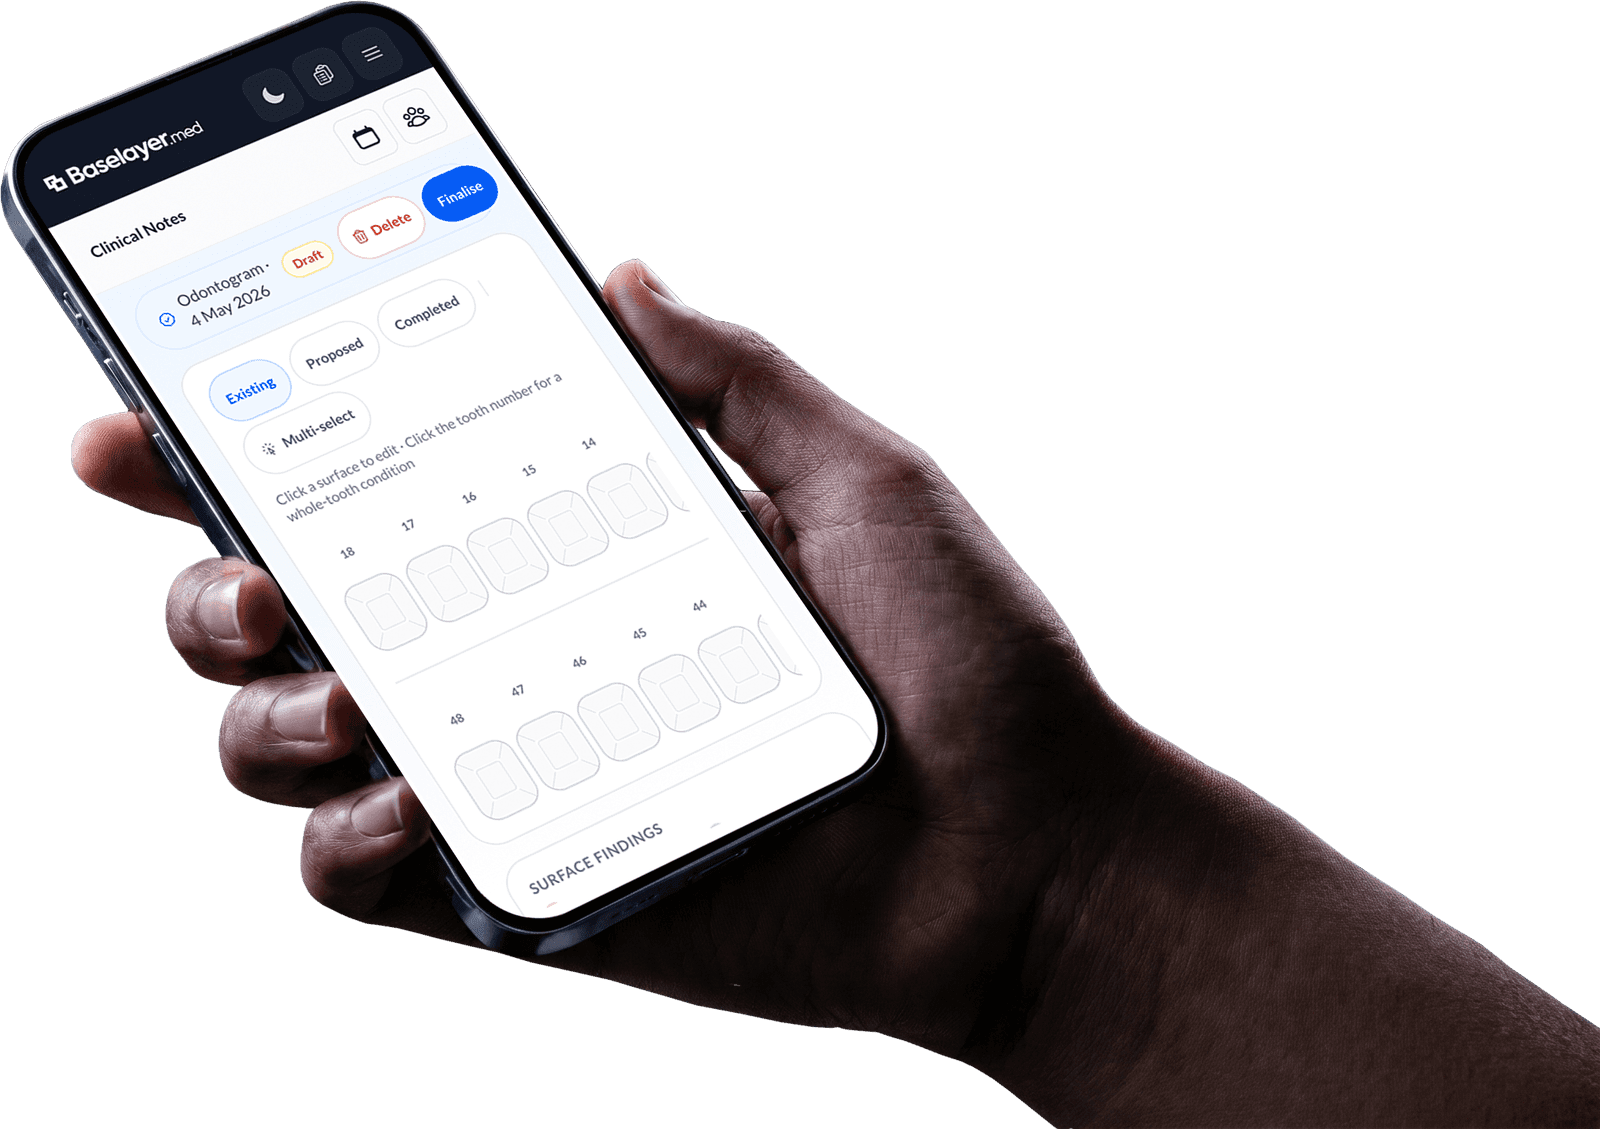
A digital odontogram and periodontal chart built for dentists and hygienists. Mark existing conditions by surface, plan treatment, capture six-point probing depths — all in FDI notation with full history.
Odontogram
Upper right · adult dentition
Tap a surface.
Mark the work.
Click any tooth surface to record caries, restorations, crowns, bridges, implants, root canals, extractions, and more. Whole-tooth conditions (missing, implant) live alongside surface-scoped marks so one tooth can tell its full story.
Perio chart
Upper right · buccal sites
Probe. Bleed. CAL calculated.
A gridded perio chart with six sites per tooth for probing depth, bleeding on probing, recession, mobility, and furcation. Clinical Attachment Level is computed automatically and colour-coded by severity so risk jumps off the page.
Chart history
Last 12 months- Finalized
Odontogram
21 Apr 2026 · Dr Smith
- Draft
Perio chart
21 Apr 2026 · Hygienist Nadia
- Finalized
Odontogram
03 Jan 2026 · Dr Smith
- Finalized
Perio chart
03 Jan 2026 · Hygienist Nadia

Existing. Proposed.
Completed.
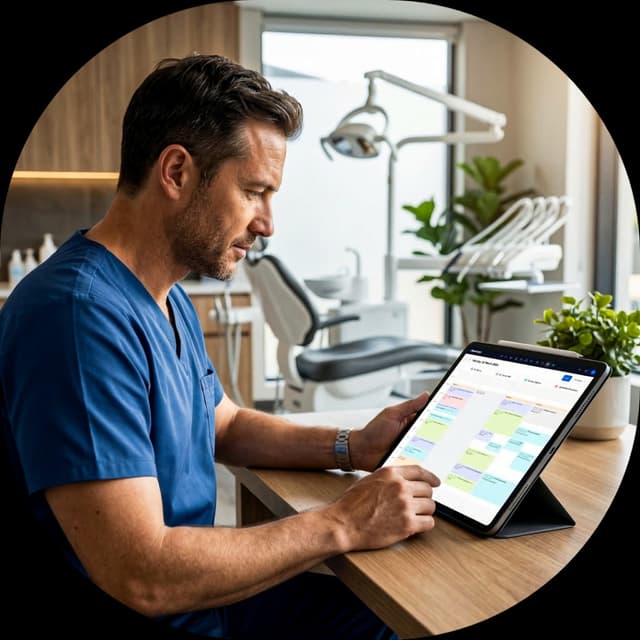
Switch layers to reason about what is in the mouth today, what you are planning, and what you have completed this visit. Every chart is versioned and stored per visit so the patient record reads like a narrative, not a snapshot.
Explore more solutions
Every feature works together as part of one connected platform.
Ready to retire paper charts?
Book a demo and see how digital charting keeps every visit, every surface, and every site documented in one place.
Start 60-Day Free Trial